
School meals in focus: Summary of findings from a national survey of parents (2025)
To access the PDF version of this content, click here
The U.S. Department of Agriculture (USDA) administers the National School Lunch and School Breakfast Programs (school meals programs), which serve nearly 30 million children annually.1 The nutritional quality of school meals has improved significantly since the passage of the Healthy, Hunger-Free Kids Act in 2010.2 A 2021 study assessing the nutritional quality of major food sources for adults and children found that school meals were the most nutritious, followed by food from grocery stores, other sources, and restaurants.3 The USDA last updated the school meal nutrition standards in 2024 to include the first-ever limit on added sugars, which will be phased in by School Year 2027-28.4
Despite these gains, there is more to be done to improve access to, support for, and maintain the nutritional quality of school meals. The ongoing policy debates on these issues demonstrate the need for a coordinated approach to policy advocacy and priority setting. For example, in 2025 alone, numerous states have introduced or passed legislation regulating ultra-processed foods (UPFs) and ingredients in school foods, creating a patchwork of state policies which pose challenges for implementation.5,6 In addition to a renewed focus on the quality of school meals, in the last five years, numerous states have recognized the benefits of covering the cost of school meals for every student and have passed policies.7 Some states have made incremental progress towards free meals for all students, such as providing free breakfast only, or eliminated the reduced-price category.
CSPI seeks to ensure that all children across the U.S. have access to nutritious, safe, and sustainable foods. Understanding parent perceptions of school meals is essential not only because parents observe the real-world impact of these programs, but also because they represent a critical yet under- activated group in school meals advocacy. Parents can play a powerful role in shaping public support and influencing decision-makers when equipped with accurate information and clear opportunities for engagement.
Their perspectives help clarify priorities in an advocacy landscape that is often fragmented, highlighting both the strengths of existing school meal programs and areas where clearer communication, education, or programmatic improvements are needed. Addressing common misperceptions or misinformation can empower parents to serve as more effective advocates, while also providing advocacy organizations with insights to strengthen stakeholder engagement strategies and outreach efforts.
Survey methods
In June 2025, CSPI commissioned a national survey to assess. We sought to learn what parents and caregivers of school-aged children across a range of socio-demographic groups and political affiliations think about school meals. The survey explored opinions on the healthfulness of school meals, knowledge about consumption patterns, and the importance of various meal qualities such as cultural relevance, sustainability, and affordability. It also assessed parents’ knowledge of school meal costs and federal nutrition standards, perceptions of ultra-processed foods (UPFs), and support for policies such as banning harmful additives and providing free meals to all students.
Big Village’s CARAVAN U.S. Online Omnibus Survey was administered June 3–11, 2025 to a nationally representative sample of adults demographically balanced to the U.S. Census on age, sex, region, race, and ethnicity. Within that survey, respondents who indicated their role as a parent or guardian to at least one child under the age of 17 years living in their home were asked a set of questions regarding school meals programs. Therefore, survey respondents may not be representative of national demographic patterns.
In total, 1,513 adults who identified as parents or guardians of children ages 5 to 17 years were included in the sample. 66% of respondents indicated they had at least one child participating in either school meals program (see Appendix). Respondents were 50% female, and represented a range of household incomes (37% earning less than $50,000 per year, 39% earning $100,000 or more per year, and 34% earning between $50,000 and $99,999 per year), levels of education (26% had up to a high school education, 35% reported some college, and 39% had a college degree or higher education), and political affiliations (44% Republican, 12% Independent, 33% Democrat). Selected survey results are presented in this fact sheet.
Key findings
The survey found that a majority of parents across key demographic groups for political affiliation, education, and income:
- Support free school meals for all students, regardless of household income (81% support, overall)
- Support banning foods that contain harmful additives in schools (80% support, overall) and support banning all UPFs in school meals (71% support, overall)
- Agree that most meals offered in the National School Lunch and Breakfast Programs are healthy (70% agree, overall)
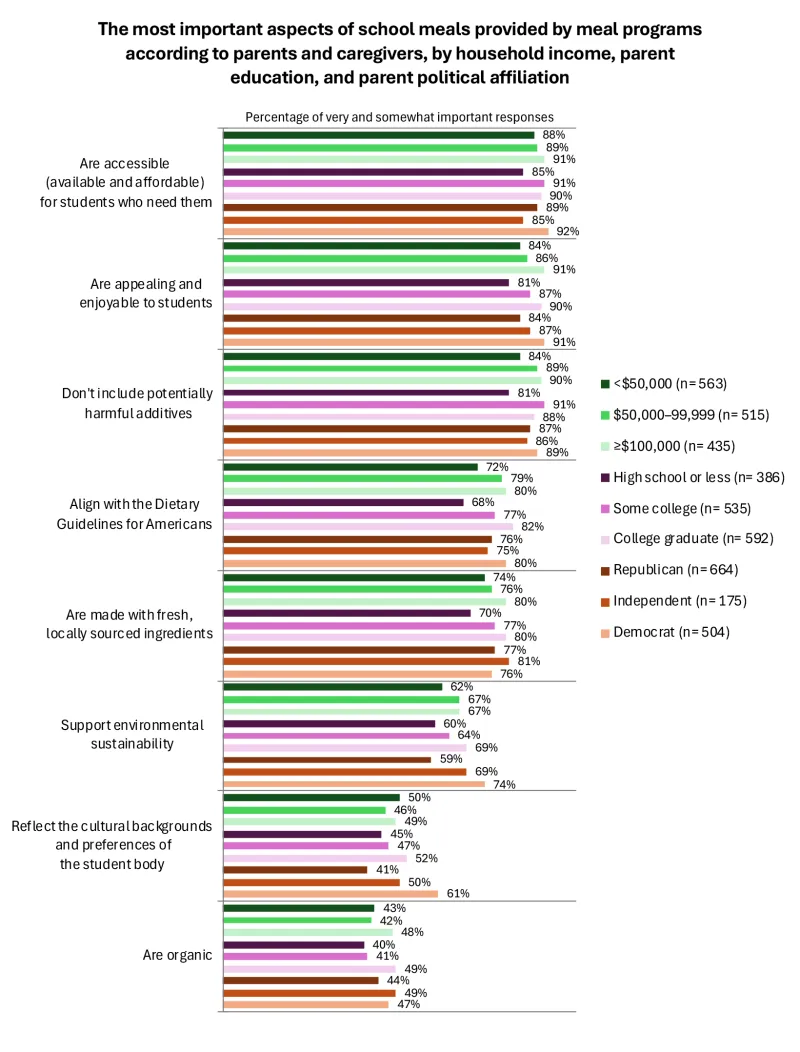
- Believe that it is important for school meals to align with the Dietary Guidelines for Americans (77% rate as very and somewhat important, overall)
- Believe that the most important aspect of school meals programs is that they are available and affordable for students who need them (89% rate as very and somewhat important, overall)
Figure 1.
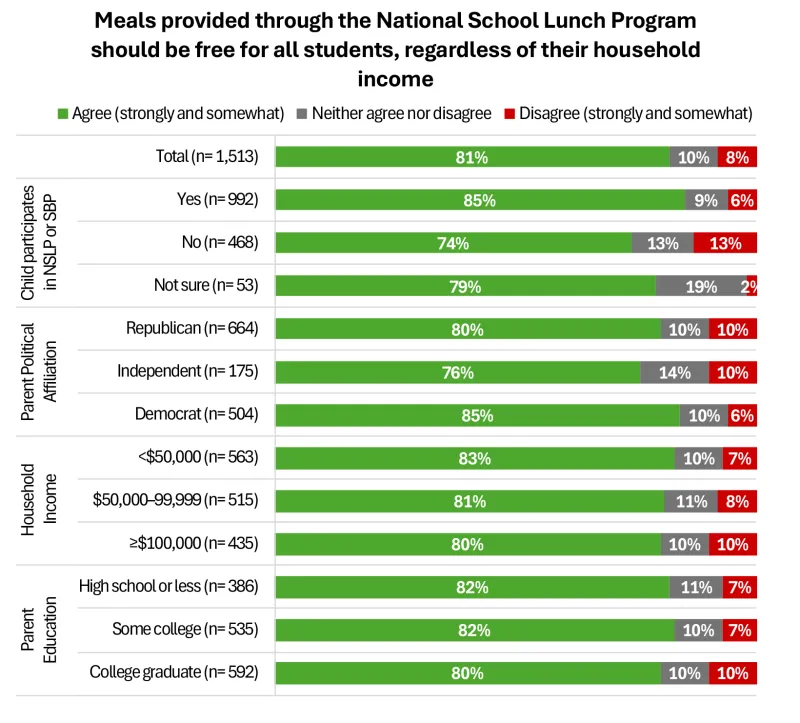
Note: Total includes the parent political affiliation group of “all others” (n= 170).
Figure 2.
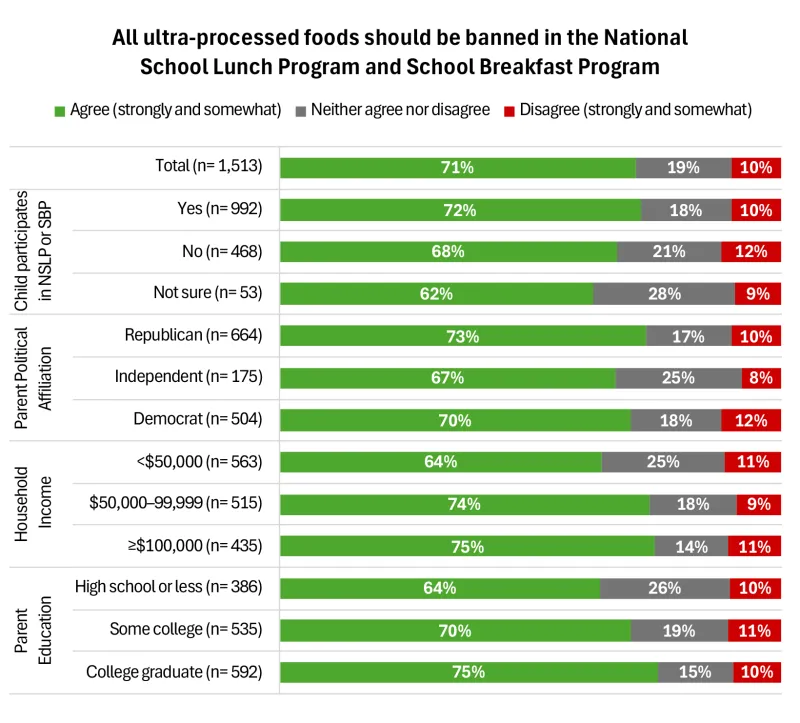
Note: The survey respondents were not provided a definition of the term “ultra-processed foods” for responding this question. In other questions, respondents were asked about the characteristics and/or ingredients that they associate with ultra-processed foods. Respondents’ opinions about ultra-processed foods differed and a majority associated high levels of added sugar, salt or fat, artificial flavors, artificial dyes or colorings, preservatives, and industrial processing methods with ultra-processed foods, in addition to other characteristics with less agreement such as low amounts of healthy vitamins and minerals, non-nutritive sweeteners, emulsifiers, and more than five ingredients. For more information see the full survey results.
Figure 3.

Figure 4.
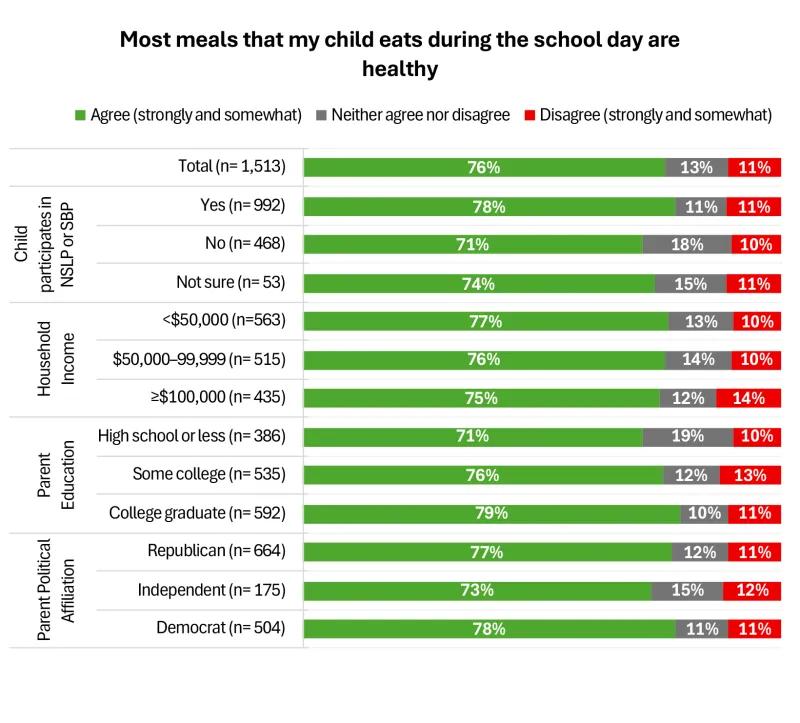
Figure 5.
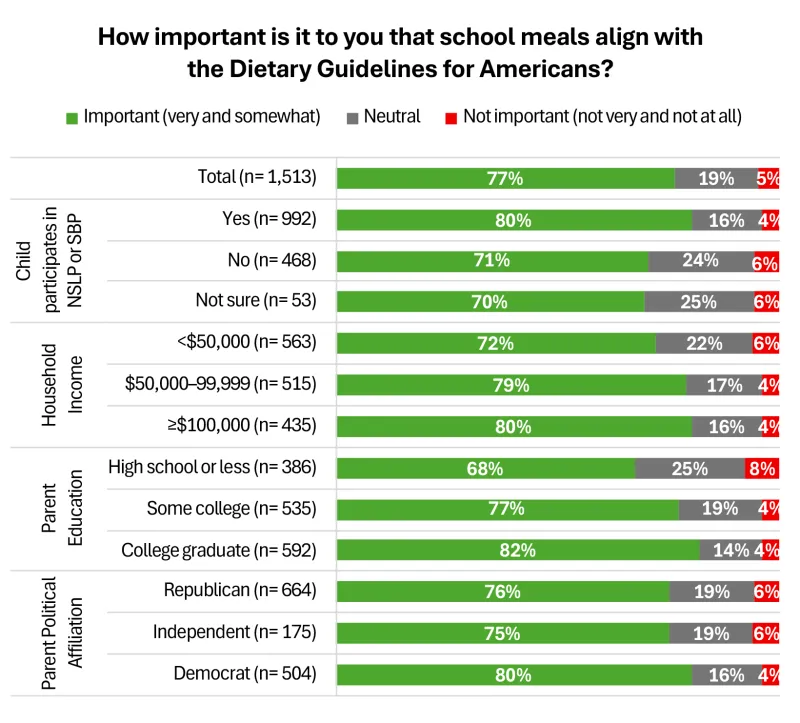
Figure 6.
Recommendations
Recommendations to raise awareness about school meals
Based on these survey results, advocates and the school nutrition community should prioritize efforts to increase awareness of the following:
- What operational costs are covered in the price of a school meal
- Existing federal school nutrition standards
Notably, fewer than half of respondents believe that the federal government has established limits on saturated fat, sodium, or calories—even though these standards have been in place for more than a decade.
Policy recommendations to improve school meals
The table below outlines CSPI’s policy recommendations in alignment with parents’ and caregivers’ top 5 priorities for school meals.
Complete survey questions and results can be found at cspi.org/SchoolMealsSurvey. For more information, please contact the Center for Science in the Public Interest at policy@cspi.org
Appendix
Table 1. Sample demographics
| Child participates in school meals programs? | ||||
|---|---|---|---|---|
| Total | Yes | No or Not Sure | ||
| Overall | 1,513 (100%) | 992 (66%) | 521 (34%) | |
| Parent Age (y) | 18–29 | 150 (10%) | 108 (72%) | 42 (28%) |
| 30–44 | 837 (55%) | 564 (67%) | 273 (33%) | |
| 45+ | 526 (35%) | 320 (61%) | 206 (39%) | |
| Race or Ethnicitya | Non-Hispanic White | 997 (66%) | 630 (63%) | 367 (37%) |
| Non-Hispanic Black | 225 (15%) | 157 (70%) | 68 (30%) | |
| Hispanic (Any Race) | 171 (11%) | 130 (76%) | 41 (24%) | |
| Income | <$50,000 | 563 (37%) | 431 (77%) | 132 (23%) |
| $50,000–99,999 | 515 (34%) | 323 (63%) | 192 (37%) | |
| ≥$100,000 | 435 (29%) | 238 (55%) | 197 (45%) | |
| Parent Gender | Male | 757 (50%) | 488 (64%) | 269 (36%) |
| Female | 750 (50%) | 500 (67%) | 250 (33%) | |
| Age of Child (y)b | 5–11 | 1,039 (69%) | 702 (68%) | 337 (32%) |
| 12–17 | 803 (53%) | 524 (65%) | 279 (35%) | |
| Parent Education | High school or less | 386 (26%) | 282 (73%) | 104 (27%) |
| Some college | 535 (35%) | 352 (66%) | 183 (34%) | |
| College graduate | 592 (39%) | 358 (60%) | 234 (40%) | |
| Parent Employment Status | Employed | 1,142 (75%) | 743 (65%) | 399 (35%) |
| Retired | 41 (3%) | 28 (68%) | 13 (32%) | |
| All Others | 330 (22%) | 221 (67%) | 109 (33%) | |
| Parent Political Affiliationc | Republican | 664 (44%) | 425 (64%) | 239 (36%) |
| Independent | 175 (12%) | 115 (66%) | 60 (34%) | |
| Democrat | 504 (33%) | 345 (68%) | 159 (32%) | |
| All others | 170 (11%) | 107 (11%) | 63 (37%) | |
| Region | Northeast | 283 (19%) | 198 (70%) | 85 (30%) |
| Midwest | 325 (21%) | 214 (66%) | 111 (34%) | |
| South | 517 (34%) | 317 (61%) | 200 (39%) | |
| West | 388 (26%) | 263 (68%) | 125 (32%) | |
| Type of Community | Urban | 497 (33%) | 351 (71%) | 146 (29%) |
| Suburban | 665 (44%) | 406 (61%) | 259 (39%) | |
| Rural | 351 (23%) | 235 (67%) | 116 (33%) | |
a Certain groups, such as other Racial or Ethnic groups and Gender Non-Conforming individuals are not reported due to small sample size. b 329 respondents reported having children in both age groups. c All others include individuals who align with another political party, are unsure, or declined to answer.
References
- U.S. Department of Agriculture. National School Lunch Program: Participation and Lunches Served. https://fns-prod.azureedge.us/sites/default/files/resource-files/slsummar-8.pdf. Accessed August 27, 2025.
- U.S. Department of Agriculture. School Nutrition and Meal Cost Study: Volume 2 – Nutritional Characteristics of School Meals (Summary). April 2019. https://fns-prod.azureedge.us/sites/default/files/resource-files/SNMCS-Volume2-Summary.pdf. Accessed August 27, 2025.
- Liu J, Micha R, Li Y, Mozaffarian D. Trends in Food Sources and Diet Quality Among US Children and Adults, 2003-2018. JAMA Netw Open. 2021;4(4):e215262.
- 89 FR 31962
- Tschopp K. States Move to Define and Restrict Ultra-Processed Foods. MultiState. August 7, 2025. https://www.multistate.us/insider/2025/8/7/states-move-to-define-and-restrict-ultra-processed-foods. Accessed November 19, 2025.
- Healthy Eating Research. Ultra-Processed Foods in School Meals: Challenges and Opportunities. December 2025. https://healthyeatingresearch.org/wp-content/uploads/2025/12/HER_UPF-Brief-1.pdf. Accessed December 11, 2025.
- Food Research Action Center. https://frac.org/healthy-school-meals-for-all. Accessed December 11, 2025.